
 Those engaged in Collective Leadership are constantly alert to the progress being made toward its goals, relying on timely, reliable information to measure the success of its efforts and make informed decisions about necessary adjustments to their plans. Lacking solid data, inaccurate assessments may be based on conjecture, emotion, idiosyncratic stories, or isolated evidence and lead to unnecessary or ineffective changes to strategy and resource allocation.
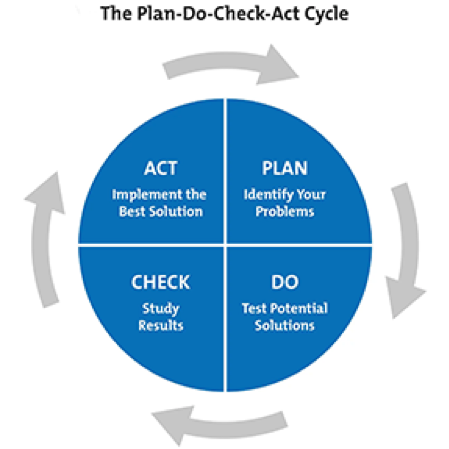
How do we measure our progress toward the vision? Appreciative Inquiry (AI) is a strength-based approach used by groups to measure and understand progress. It consists of four stages – Discover (what is working well) – Dream (what could create even better results) – Design (plan and prioritize actions) – Deploy (implement and revise). This cycle repeats itself as new understanding evolves through reflection on what has changed and what seems to be working well. AI also works well with the SOAR process by collectively examining Strengths, Opportunities, Aspirations, and Results. Another commonly used process is based on the work of W. Edwards Deming, the creator of Total Quality Management (TQM) which stresses a Plan – Do – Study – Act cycle for continuous monitoring and improvement. Other variations of this cycle have been developed, such as Plan – Do – Check – Act or Plan – Do- Check – Adjust and are generally similar in their approach.
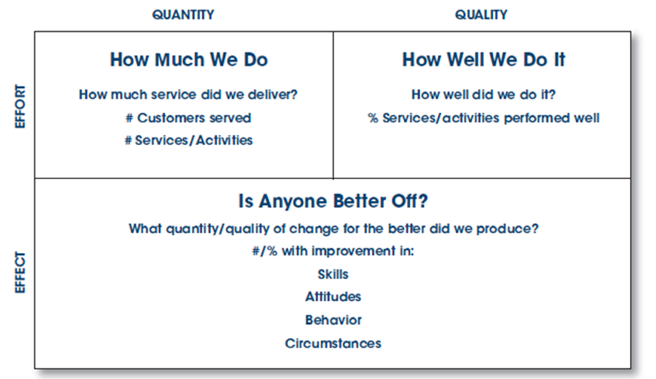
Other sections in the Toolkit (see Personal-Professional: Results-based Facilitation) describe the essential role of data in monitoring and continuous improvement, in terms of both performance and progress. Performance measurement examines effort and effect in relation to a defined target at a point in time; progress measurement examines growth or decline of a variable over time. Either may be applied to individuals, groups, programs, or institutions. RBA uses a matrix to differentiate measure of performance for their effort and impact.
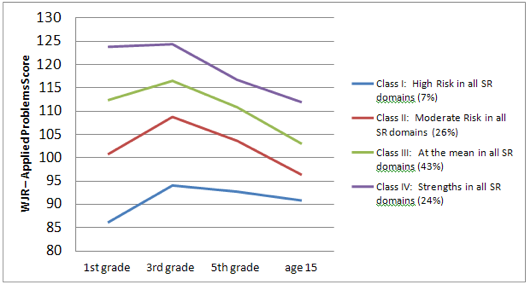
Observing trends over time is an excellent means to understanding the status of an issue and progress over time. The Behavior Over Time Graph (BOTG) is commonly used in Results-based Accountability to track conditions or outcomes over time, often in relation to interventions that were implemented. The term “variable” may be used in place of “behavior,” to examine changes in attitudes, circumstances, or knowledge and skills. In the absence of valid, reliable data, BOTG may be constructed based on stakeholders’ perceived beliefs. Regardless of actual or perceived data, BOTG are useful for measuring progress and initiating discussions about the story underlying the trend.
Resources
- Participatory Evaluation
- Gathering Information: Monitoring Your Progress (Center for Community Health and Development/Univ. Of Kansas, 2017)
- DaSy Data Governance Toolkit
- Systems Building Resource Guide: Program Design and Implementation (Child Care State Capacity Building Center, 2016)
- The Results-based Accountability Guide (Results Leadership Group, 2010)
- Appreciative Inquiry (video)
- Logic Model and Data (video)
- A Different Approach to Strategic Planning: SOAR (Capela & Brooks-Saunders, N.D.) (Powerpoint)
- An Unofficial Guide to the Why and How of State Early Childhood Data Systems (Regenstein/OUNCE, 2017)
- Tips for Behavior-Over-Time Graphs (Waters Foundation)
- Getting Started with Behavior Over Time Graphs (Richardson & Lyneis, 1998)
Activities
- BOTG With Questions (Waters Foundation)